Economic and Financial Market Update - August 2025
- Aug 20, 2025
- 7 min read
Updated: Apr 28
Recent Market Trends
The second half of 2025 is off to a positive start as equity indices continue to push to new highs, backed by continued strength in corporate earnings and largely constructive economic data. The Federal Open Market Committee meetings are in full focus following downwardly revised employment figures for May and June, which may prompt a sooner-than-later cut to the federal funds rate as early as September. Though diminished, trade policy uncertainty and subsequent volatility lingers; however, unprecedented domestic technological investment continues to support U.S. growth and support stock prices in the near term.

U.S. valuations remain elevated but are supported by stronger earnings and profitability relative to other developed markets, driven largely by the ongoing long-term trends of onshoring and reshoring of manufacturing capacity and technologically driven productivity gains. Geopolitical risks remain, as tariff negotiations and global conflicts persist, which we will continue to monitor closely.
Earnings Season Recap
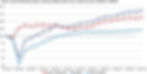
As of August 8th, with 90% of S&P 500 companies reporting results, 81% of companies have reported earnings which topped analyst estimates, above both the 5-year average of 78% and the 10-year average of 75%. Additionally, 81% of reported S&P 500 companies have topped revenue estimates, which is above both the 5-year average of 70% and the 10-year average of 64%. The current earnings growth rate of the reported S&P 500 companies is 11.8%, which would mark the third consecutive quarter of double-digit earnings growth if it persists throughout the remainder of the second quarter earnings season.1 Perhaps unsurprisingly, the outlier in earnings performance is the materials sector, which may be disproportionately affected by tariff-related price fluctuations in commodities. See below.

Economic Growth
Bureau of Economic Analysis GDP (Q2 2025, Advance Estimate)
For the second quarter of 2025, real gross domestic product (GDP) increased at an annual rate of +3.0%, beating Wall Street expectations of +2.0% growth, and following a -0.5% decline in the first quarter (attributed to an increase in imports). Again, while a negative quarter of GDP growth is uncommon during an expansionary period, it is not altogether indicative of a recession.

In contrast to the first quarter, where an outsized surge in imports (which are a subtraction in the calculation of GDP) pushed GDP into negative territory, the increase in real GDP in the second quarter primarily reflected a decrease in imports and an increase in consumer spending. These movements were partly offset by decreases in investment and exports, a reversal from the prior quarter.2

Federal Reserve Bank of Atlanta GDPNow
The August 15th GDPNow model estimate for third quarter real GDP growth is +2.5%. Institutional forecasts for the current quarter remain largely positive with the consensus between +0.5% and +1.0%, indicating that two consecutive quarters of negative GDP growth, and thus a recession, are not anticipated.

GDPNow is not an official forecast of the Atlanta Fed. Rather, it is best viewed as a running estimate of real GDP growth based on available economic data for the current measured quarter. 3
Bureau of Labor Statistics Productivity and Costs (Q2 2025, preliminary estimate)
U.S. labor productivity in the nonfarm business sector rose by +2.4% in the second quarter, better than expectations of +2.0%, but follows a downwardly revised -1.8% (was -1.5%) drop in the first quarter. Productivity growth was primarily driven by a +3.7% increase in output (up from -0.6% in Q1) while hours worked ticked up to +1.3% (up from +1.2% in Q1).4 Productivity gains in the U.S. continue to be driven by technological innovation, such as artificial intelligence for research, development, and automation, as well as continued onshoring and reshoring of manufacturing capacity, which decreases transportation costs, streamlines supply chains, and increases operational efficiency.5
Inflation Data
Bureau of Economic Analysis Personal Consumption Expenditures
Per the July 31st report, the Personal Consumption Expenditures (PCE) price index rose +0.3% in June, or +2.6% annualized. The core reading (which excludes volatile food and energy prices) increased +0.2%, or +2.8% annualized. Both readings were slightly higher than analyst estimates and remain above the Fed’s +2.0% annualized target rate.6

Since 2000, the Federal Reserve has utilized the PCE price index as its preferred measure of inflation as it better reflects changes in consumer spending and covers a broader range of spending than comparable alternatives. It is also weighted by data supplied by business surveys, which tend to be more reliable than consumer surveys.7
Labor Data
U.S. Bureau of Labor Statistics Employment Situation
Total nonfarm payroll employment increased by +73k jobs in July, missing estimates of +115k and showing little change since April. The unemployment rate, at 4.2%, also changed little in July. Employment continued to trend up in health care (+55k) and in social assistance (+18k) while federal government (-12k) continued to lose jobs. The unemployment rate has remained within 4.0%-4.2% since May 2024. The labor force participation rate, at 62.2%, changed little in July but has declined by -0.5% over the year.

Notably, revisions for May and June were larger than normal. The change in total nonfarm payroll employment for May was revised down by -125k (from +144k to +19k) and the change for June was revised down by -133k (from +147k to +14k). Following these revisions, employment in May and June combined is -258k lower than previously reported, which adds additional pressure to the Fed’s rate cut decision making at the September meeting.8
U.S. Department of Labor Initial Jobless Claims
In contrast to the downward revisions in BLS data, initial jobless claims have consistently been largely better than expected in recent months. For the week ending August 9th, initial claims were 224k, lower than estimates of 230k. The four-week moving average was 221,750, remaining within the historically healthy range of 200-250k. Continuing claims, at 1,953k, were again lower than estimates of 1,960k but have remained at a slightly elevated level since June, indicating that job losses are not rising but hiring is slowing in comparison to recent months.9

Sentiment and Confidence
Corporate Earnings Call Analysis
Though not a traditional sentiment metric, an interesting data point from second quarter earnings calls displays that far fewer companies are discussing the possibility of recession than in the prior period. From June 15th through August 7th with 442 earnings calls having taken place, the term “recession” was cited in only 16 earnings calls, which is well below the 5-year average of 74 and the 10-year average of 61. This represents an 87% decline when compared to the first quarter, indicating that clarity on the severity and timeline of punitive trade policies has significantly eased fears of economic slowdown while earnings results continue to surprise on the upside.1

Our Thoughts
Though the macroeconomic outlook as it relates to global trade policy remains opaque, market reactions to this ongoing uncertainty remain muted as the market has become desensitized to tariff policy. Despite recent trade deal announcements, we continue to expect heightened volatility, as tariffs on critical goods – such as rare earth minerals, semiconductors, and pharmaceuticals – remain a point of contention. We expect the effects of these policies to materialize in the coming months. In the interim, the market has remained remarkably resilient, supported by better-than-anticipated corporate earnings, productivity, and economic growth, moderating inflationary pressures, and a stable labor environment. Since early July, major U.S. stock indices have continuously reached new highs and the U.S. economy remains on sound footing. As always, we closely monitor both ‘soft’ and ‘hard’ data, which continues to support our cautiously optimistic outlook.
Going forward, we anticipate meaningful productivity gains to uniquely benefit the U.S. economy as a result of the unparalleled investment and implementation of artificial intelligence technologies coupled with the ongoing trend of onshoring and reshoring of manufacturing capacity. Additionally, anticipated deregulation, corporate tax cuts, and interest rate cuts should continue to support economic growth.
With the market reaching all-time highs, we will be opportunistic in balancing risk by moderately reducing equity exposure and will continue to focus on rebalancing into short-term fixed income, as equity allocations in client portfolios have moved toward the higher end of desired weightings. We will be mindful of tax efficiency and will remain diversified within the equity portfolio.
As always, we believe patience, discipline, and maintaining a long-term perspective are of paramount importance in achieving superior long-term absolute positive and relative rates of return. We highly value your relationship, thank you for your confidence, and look forward to meeting you soon.
Sources
1https://advantage.factset.com/hubfs/Website/Resources%20Section/Research%20Desk/Earnings%20Insight/EarningsInsight_080825.pdf
Disclosures
Investment advice offered through Stratos Wealth Partners, Ltd., a registered investment advisor. Stratos Wealth Partners, Ltd. and Parkview Partners Capital Management are separate entities.
The information contained herein has been obtained from sources known to be reliable. However, no guarantee, representation, or warranty, express or implied, is made as to its accuracy, completeness, or correctness.
There is no guarantee a diversified portfolio will enhance overall returns or outperform a non-diversified portfolio.
Diversification and asset allocation do not protect against market risk. International investing involves special risks such as currency fluctuation and political instability and may not be suitable for all investors.
Bonds are subject to market and interest rate risk if sold prior to maturity. Bond values will decline as interest rates rise and bonds are subject to availability and change in price. Bond yields are subject to change. Certain call or special redemption features may exist which could impact yield.
The opinions voiced in this material are for general information only and not intended to provide specific advice or recommendations for any individual. To determine which investment(s) may be appropriate for you, consult your financial advisor prior to investing. All performance referenced is historical and is no guarantee of future results. Indices are unmanaged and may not be invested into directly. Investing involves risk including loss of principal.
The economic forecasts set forth in this material may not develop as predicted and there can be no guarantee that strategies promoted will be successful.
Stratos Wealth Partners and its affiliates do not provide tax, legal or accounting advice. This material has been prepared for informational purposes only, and is not intended to provide, and should not be relied on for, tax, legal or accounting advice. You should consult your own tax, legal and accounting advisors before engaging in any transaction.