

Understanding the Average Rate of Return
The average rate of return is a commonly used metric intended to measure how an investment or portfolio has performed over a specific period. It is typically expressed as a percentage and reflects historical results rather than future expectations.
While this figure can provide useful context, it represents past performance only. It does not indicate how investments will perform in the future and should be evaluated alongside broader financial considerations.
What the Average Rate of Return Represents
The average rate of return summarizes how investments have performed over time. However, as a summary measure, it may not capture the full experience of an investor.
For example:
It reflects historical data rather than forward-looking outcomes
It may not fully account for volatility across different periods
It does not incorporate personal factors such as timing of contributions or withdrawals
Because of these limitations, the metric is typically used as one component within a broader evaluation of portfolio performance.
Methods of Calculating Average Returns
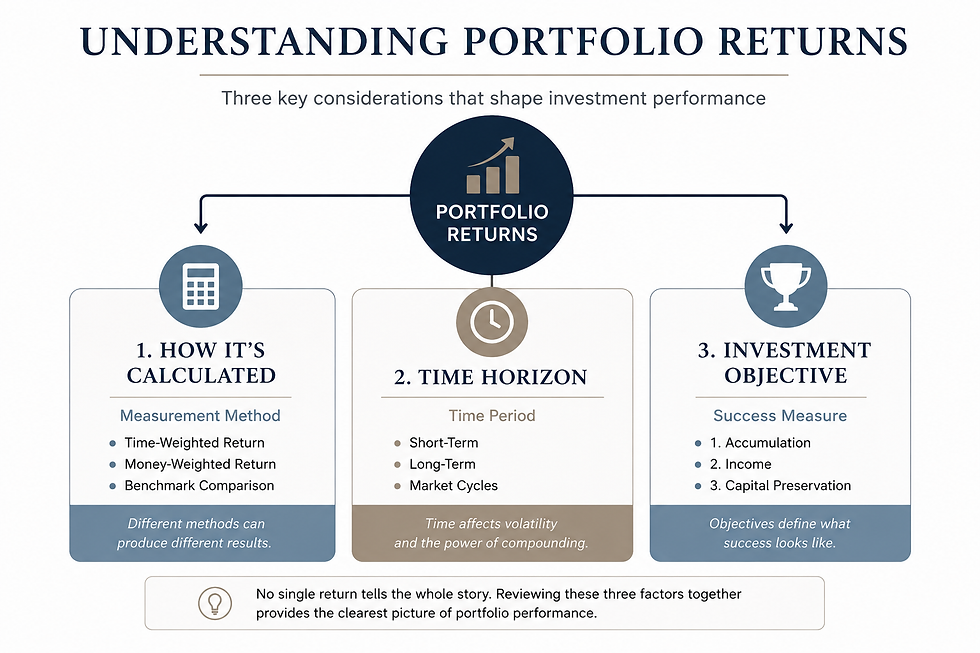
The method used to calculate returns can influence how performance is interpreted. Two commonly referenced approaches are the arithmetic mean and the geometric mean.
Arithmetic Mean
The arithmetic mean calculates the average return across multiple periods by adding returns together and dividing by the number of periods.
Provides a simple, high-level snapshot
May be useful for evaluating a single period
Does not account for compounding effects over time
Geometric Mean (Compound Annual Growth Rate)
The geometric mean, often referred to as the compound annual growth rate (CAGR), accounts for compounding and volatility.
Reflects how an investment actually grew over time
Incorporates the effect of gains and losses across periods
May provide a more realistic view of long-term performance
For multi-year evaluations, this approach is commonly considered more representative of actual outcomes.
Why Averages May Be Misleading
Average returns can sometimes obscure variability in performance.
For instance:
Periods of strong gains and losses may offset each other
The “average” year rarely occurs in practice
Market returns tend to fluctuate rather than follow a consistent path
As a result, evaluating performance often involves reviewing both averages and the range of outcomes experienced over time.
Historical Context and Long-Term Perspective
Historical market data is often used to provide context for understanding average returns. Over extended periods, broad market indexes have demonstrated patterns of growth, although returns have varied significantly year to year.
Key considerations include:
Long-term trends may differ from short-term results
Periods of volatility are a normal part of market behavior
Historical performance does not guarantee future outcomes
Maintaining a long-term perspective may help place short-term fluctuations in context.
The Role of Diversification and Global Perspective
Focusing on a single market or region may provide an incomplete view of potential outcomes.
A broader perspective may include:
Exposure to multiple geographic regions
Diversification across asset classes
Consideration of different economic environments
Global diversification may help reduce reliance on any single market, although it introduces additional considerations such as currency and geopolitical risks.

Volatility and the “Uncommon Average”
Market returns are often uneven, with significant variation from year to year.
Returns may deviate substantially from long-term averages
Periods of decline and recovery are typical
Short-term results may differ from long-term trends
Understanding this variability may help frame expectations around investment performance.
Using Return Data in Financial Planning
The average rate of return is one of several tools used to evaluate investment performance.
When reviewing return data, individuals may consider:
The time horizon of their financial goals
The level of risk associated with the portfolio
The consistency of returns over time
Alignment with broader financial objectives
Because individual circumstances vary, return metrics are typically evaluated within the context of a comprehensive financial plan.

Conclusion
The average rate of return provides a useful reference point for understanding historical investment performance. However, it represents only one aspect of a broader evaluation.
A well-rounded approach to financial planning often incorporates multiple factors, including risk, time horizon, diversification, and individual goals. Understanding how return metrics are calculated and interpreted may support more informed decision-making over time.
Securities offered through LPL Financial, Member FINRA/SIPC. Investment advice offered through Stratos Wealth Partners, Ltd., a registered investment advisor. Stratos Wealth Partners, Ltd. and Parkview Partners Capital Management are separate entities. This material is provided for informational purposes only and should not be considered investment, tax, or legal advice. Individuals should consult their professional advisors regarding their specific circumstances. Past performance is not a guarantee of future results.


Comments