

A Guide to Investment Performance Reporting
This content is for informational purposes only and does not constitute financial, legal, or tax advice. Please consult a licensed professional for advice specific to your situation.
At its heart, investment performance reporting can be seen as the process of checking the scoreboard. It’s how we measure how well a financial strategy may be working—aiming to grow capital and deliver returns over a specific period. This report is intended as a source of truth, providing a clear, objective look at the progress you may be making toward your financial goals.
Understanding Your Investment Performance Report
Your performance report can be viewed not as a dense financial statement, but as a detailed map and compass for your wealth journey. It is designed to be a tool that may help build a productive and confident partnership. This single document tells the story of where your portfolio has been, where it stands today, and importantly, may help chart the course for what’s next.
Getting comfortable with the details in this report can empower you to make more informed decisions. It can give you the context needed to ask sharper questions in review meetings and helps ensure your investment strategy remains aligned with your long-term ambitions. Without this feedback, an investor might feel they are flying blind, unsure if their plan is on track or if it's time for a course correction.
More Than Numbers: The Bedrock of Your Advisory Partnership
A well-crafted report does far more than just present numbers; it is designed to build transparency and trust. It provides the data needed to evaluate not just the movements of the market, but the potential effectiveness of the strategies being used on your behalf. That kind of clarity can be the foundation of a strong client-advisor relationship.
For example, by looking at your performance reports over time, you can see how your portfolio reacts during both bull and bear markets. This can foster a shared understanding and open the door to productive conversations about risk, returns, and any strategic adjustments that might be considered.
Implementation considerations:
Set a Regular Review Cadence: We find that reviewing performance reports together quarterly can be beneficial. This keeps you informed without encouraging reactions to the market’s daily noise.
Come Prepared with Questions: As you read through the report before a meeting, jotting down anything that stands out or seems unclear can make the time together incredibly focused and valuable.
Focus on the Forest, Not Just the Trees: While quarterly figures are useful, the real story can be in the multi-year performance data. That’s where we can truly gauge the progress toward your most important long-range goals.
Ultimately, effective investment performance reporting is designed to turn abstract data into actionable insight. It can change the conversation from a passive update into an active, collaborative dialogue—and that is a cornerstone of our fiduciary commitment here at Parkview Partners Capital Management.
Decoding the Core Performance Metrics
To get the full story from your investment report, it is helpful to know the language it's speaking. Every report uses a handful of key metrics to show how a portfolio may be doing, and each number provides a slightly different piece of the puzzle. Getting a handle on these core concepts is one step to turning a dense report into a clear roadmap for your financial strategy.
At the heart of any performance conversation are two different ways of calculating returns: the Time-Weighted Rate of Return (TWRR) and the Money-Weighted Rate of Return (MWRR). You'll often see MWRR referred to as the Internal Rate of Return, or IRR. While they sound alike, they answer two completely different—but equally important—questions.
Time-Weighted vs. Money-Weighted Return
Think of the Time-Weighted Rate of Return (TWRR) as the purist’s metric. It’s designed to answer one question: How well did the investment strategy itself perform? To do this, it strips out the effects of an investor's decisions to add or withdraw money. This makes TWRR a standard for judging an advisor’s strategy or the quality of a specific fund, because it isolates performance from an investor's cash flow timing.
The Money-Weighted Rate of Return (MWRR), on the other hand, tells a personal story. This calculation is directly influenced by the timing and size of contributions and withdrawals. For example, if you invested a large sum of cash right before the market took off, your MWRR would get a boost. It reflects how your own timing decisions impacted your final outcome, giving you a picture of your actual investment experience.
To put it simply, these two metrics may help clarify whether it was the manager's strategy or your cash flow timing that drove the results.
Below is a table that breaks down the key differences and shows when each calculation might be used.
Time-Weighted vs. Money-Weighted Return
Metric | What It Measures | Best Use Case |
Time-Weighted Return (TWRR) | The compound growth rate of $1 invested in the portfolio. It isolates the manager's performance by removing the effects of cash flows. | Comparing the performance of different investment managers or funds against a benchmark. |
Money-Weighted Return (MWRR / IRR) | The portfolio's actual performance, including the impact of the timing and size of investor contributions and withdrawals. | Understanding your personal, real-world return and how your own cash flow decisions may have affected the outcome. |
Choosing the right metric depends entirely on the question you're asking. Are you evaluating your advisor's strategy, or are you assessing your own personal investment journey? A good report may use both to tell the complete story.
This is why a solid investment report can be so much more than just a list of numbers. It’s a tool for connecting the dots between past performance, your current holdings, and your future goals.

As the visual shows, effective reporting isn't just a look in the rearview mirror. It uses historical context to ground your current position and help you confidently chart the path ahead.
Key Risk-Adjusted Metrics
Of course, return figures do not exist in a vacuum. To really understand performance, you have to know how much risk was taken to achieve it. That’s where a few other key metrics come into play, adding crucial layers of context.
Sharpe Ratio: This is probably the most well-known risk-adjusted metric. It essentially asks, "How much return did I get for every unit of risk I took on?" A higher Sharpe Ratio may suggest a more efficient, risk-aware performance. Risk considerations vary by individual circumstances.
Alpha: This metric measures a portfolio's performance against its benchmark, after accounting for market risk. A positive Alpha may suggest the manager's active decisions added value above and beyond what the market delivered. A negative Alpha may suggest the opposite.
Ultimately, these are not just financial buzzwords; they are diagnostic tools. When you understand what each one is telling you, you can move beyond simply looking at the bottom-line return and have a much deeper, more productive conversation with your advisor about what may be driving your portfolio.
The Critical Role of Benchmarks in Investment Performance Reporting

Performance metrics like Time-Weighted Return (TWRR) and Internal Rate of Return (IRR) are just numbers on a page until you give them context. What does a 10% annual return really mean? It might sound good, but what if the overall market jumped 15% during that same time? Suddenly, that 10% looks different.
This is exactly why we use benchmarks. A benchmark is a standard used to measure a portfolio’s performance. Think of it like par on a golf course—it’s the score you’re aiming for. Without it, you are just hitting a ball in a field with no real way to tell if you’re making progress.
Selecting an Appropriate Benchmark
Of course, the comparison only works if it’s fair. The single most important rule is to pick a benchmark that actually reflects the portfolio’s strategy. You wouldn't judge a marathon runner by a sprinter's time, right?
The same logic applies here. If a portfolio is full of U.S. large-cap stocks, comparing it to the S&P 500 can make sense. But pitting that same portfolio against an emerging markets index is an apples-to-oranges comparison that may not be useful. The point of effective investment performance reporting is to help answer one question: did our active management add value, or could we have done just as well (or better) by simply owning the index?
Implementation considerations:
Custom Blended Benchmarks: Most sophisticated portfolios may hold a mix of asset classes. For these, a single index won't do. One possible strategy is a custom blended benchmark, which combines multiple indices in proportions that match the portfolio's target allocation (e.g., 60% S&P 500 and 40% Bloomberg U.S. Aggregate Bond Index). This can create a more accurate yardstick.
Style and Size Consistency: It may be helpful to drill down even further. Is the portfolio focused on growth or value stocks? Large-cap or small-cap companies? The benchmark must align with the portfolio's specific style and size focus to ensure the comparison is fair.
Regular Review: Markets and strategies change over time. A benchmark isn’t a "set it and forget it" tool. It's important to review your benchmarks periodically to make sure they still accurately reflect the investment strategy.
Moving Beyond the Index with Peer Analysis
Benchmarks are useful for measuring performance against a passive market, but they don't tell you how you stacked up against other professionals trying to do the same thing. That’s where peer group analysis comes in, which can add another layer of context.
Peer analysis shows how your portfolio may have performed relative to other investment managers running similar strategies. This can help you understand where you stand in the competitive universe of active management. For example, imagine your portfolio and its benchmark were both down for the year. But what if peer analysis showed your portfolio actually outperformed 80% of similar active funds? This changes the story. It may show that while the market was tough, your manager navigated the downturn well.
When you combine sharp benchmark comparisons with insightful peer analysis, you can get a more complete picture. You can see how you did against the market and against direct competitors, leading to a richer and more meaningful conversation about performance.
Anatomy of a Clear and Compliant Report
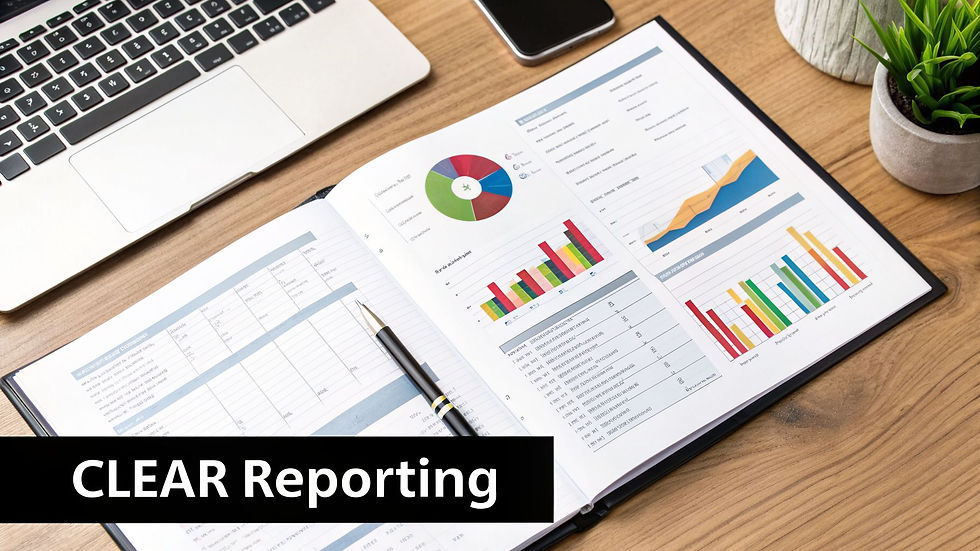
A quality investment report does more than just throw numbers on a page. It can tell a story. The best ones are built with a specific structure designed for clarity, giving you a transparent and complete picture of how your strategy may be playing out in the real world. This isn't just about good design; it’s about providing insights that can help with smart decisions.
Every report should kick off with an executive summary. Think of this as the "CliffsNotes" version—it pulls out the most important highlights, performance numbers, and market context from the reporting period. It lets you get the big picture in just a few moments before you dig into the finer details.
Core Structural Components
After the summary, a truly useful report will unpack the portfolio piece by piece. Each section is designed to answer a specific question, moving from a bird's-eye view of your allocation all the way down to the individual trades.
First up, you should see a clear snapshot of your asset allocation. This is usually a simple pie chart or bar graph that shows you the exact mix of your investments—how much is in domestic stocks, international bonds, alternatives, and so on. It’s a quick check to see if your portfolio is still on track with its long-term goals.
From there, the report dives into a detailed performance breakdown. This is where you see the returns not just for the total portfolio, but for each slice of the pie and sometimes even for each individual security. This can help you and your advisor pinpoint what's working and what isn't.
Finally, a complete transaction history acts as a detailed log of every single move made in your account. Buys, sells, deposits, withdrawals—it's all there. This section provides accountability and leaves little room for confusion.
The Standard for Ethical Reporting
To help ensure these reports are not just clear but also trustworthy and consistent, many top-tier firms voluntarily follow the Global Investment Performance Standards (GIPS®). These are essentially the ethical rules of the road for calculating and presenting investment performance.
Think of GIPS standards as the financial world’s version of a universal yardstick. When a firm states it is GIPS-compliant, it is making a public commitment to full disclosure and fair representation. This can give you confidence that their performance numbers are not misleading and can be accurately compared against other firms that also follow the standard.
Implementation considerations:
Visual Clarity: Clean charts and well-designed graphs are essential. A good visual can make a complex trend immediately obvious, helping you spot long-term patterns in performance or shifts in your asset mix without having to squint at a spreadsheet.
Consistent Methodologies: The report must be upfront about how it calculates returns, stating clearly whether it’s using Time-Weighted (TWRR) or Money-Weighted (MWRR) methods. It is also good practice to show returns both net-of-fees and gross-of-fees, side-by-side for the same time periods.
Comprehensive Disclosures: A compliant report should clearly identify the benchmark used for comparison, fully explain the fee structure, and provide important context on the market conditions that influenced your portfolio's results.
By bringing together a logical structure and a firm commitment to standards like GIPS, a simple report can transform into a powerful tool. It may build trust and foster the kind of productive, informed conversations that are at the heart of a great advisor-client relationship.
Conclusion: Your Path to Confident Investing
Your investment performance reporting can be seen as more than just a report card for your money. It's the story of your financial journey, and understanding how to read it is one of the powerful things you can do for your own peace of mind. These reports are not just collections of numbers; they can be the very foundation of a trusting, transparent relationship with your advisor.
When you can confidently talk about key metrics, grasp why certain benchmarks matter, and have real conversations with your advisor, it may all click. The report stops being a passive document you file away and can become a dynamic tool for making smart decisions together.
A Commitment to Clarity and Confidence
At Parkview Partners Capital Management, we believe clear, insightful reporting is non-negotiable. It is our responsibility to cut through the market noise and show you what may be happening with your wealth in a way that makes sense. We aim to translate the data into a clear story, giving you insights to move forward.
An effective investment performance reporting process does not just look backward at results; it is designed to illuminate the path forward, ensuring every strategic decision is made with purpose and clarity. This can build the confidence needed to stay disciplined through all market cycles. Our entire process is built around this idea. We are convinced that when you truly understand the "why" behind your portfolio's performance, you may be better prepared to stick with your strategy and navigate your financial life with conviction.
Your Next Step
Your goals are your own, and your reporting should reflect that. The concepts we’ve covered—from picking the right metrics to analyzing benchmarks—are the exact tools we use every day to build and monitor strategies intended to fit your life. Regular, in-depth reviews are where the magic can happen. They help keep your plan on track and ensure it adapts as your life and the markets change. We encourage you to treat these reports as the starting point for a great conversation. Embracing your investment performance reporting is one step toward building a more confident and successful financial future.
This content is for informational purposes only and does not constitute financial, legal, or tax advice. Parkview Partners Capital Management is a registered investment advisor. Please consult a licensed professional for advice specific to your situation. Past performance is not a guarantee of future results.
To discuss how these strategies might apply to your specific situation, contact Parkview Partners Capital Management for a personalized consultation. You can also find important disclosures, including our Form CRS, on our site.


Comments